


One page. Total clarity
Finranks gives you a complete view of any stock
on a single page with intuitive scores based on
deep analysis of 70+ core data points across growth, valuation, competitive strength, and more.
on a single page with intuitive scores based on
deep analysis of 70+ core data points across growth, valuation, competitive strength, and more.
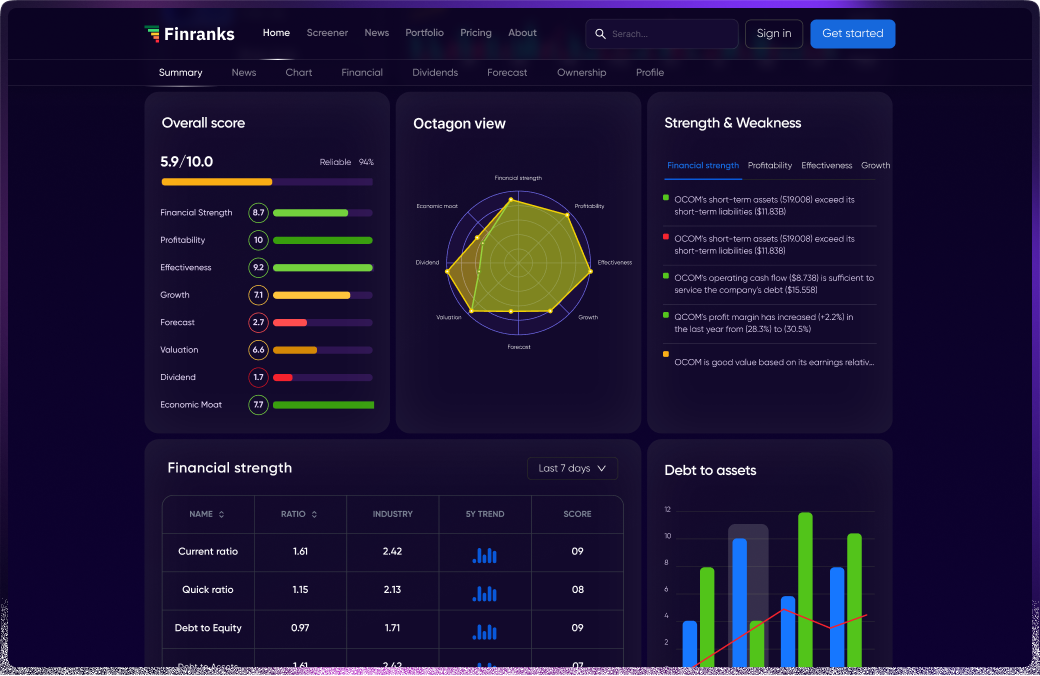
Powerful 8-dimension ranking system
Finranks breaks down complex financials into simple scores across 8 critical categories
helping you evaluate companies with confidence, even if you're not a finance expert.
helping you evaluate companies with confidence, even if you're not a finance expert.
Octagon view
8 categories

Financial Strength
Measures how stable and debt-resilient a company is

Profitability
Shows how efficiently a company turns revenue into profit and cash

Effectiveness
Evaluates how well a company uses its assets, capital, and equity to generate returns

Growth
Tracks how consistently the company is increasing its revenue, profits, and cash flow
Forecast
Summarizes analyst expectations, earnings estimates, and future outlook
Valuation
Compares the stock's price to its actual worth using ratios and DCF models
Dividend
Assesses dividend yield, payout safety, and consistency for income-focused investors
Economic moat
Measures how strong and sustainable the company's competitive advantage
Real valuation. Tailored for each stock
Finranks calculates fair value using a custom DCF model for each company
— reflecting its unique financials, risk profile, and future potential.
— reflecting its unique financials, risk profile, and future potential.
DCF model
The DCF (Discounted Cash Flow) model estimates a company’s true value
based on its future cash flows, adjusted for risk and time
based on its future cash flows, adjusted for risk and time
- DCF Model
 5 years
 - Discount rate12.79%
- Perpetual growth rate3.00%
- Revenue 5 year cagr14.00%
- FCF 5 year cagr5
- Fair value353.69$
- Stock price412.23$
Fair value
$3
UndervaluedStock PriceOvervalued
$1
Fair value
Our proprietary valuation gauge instantly shows whether a stock is undervalued, fairly priced, or overvalued compared to its calculated fair value.